Category Archives: Politics

Power source growth rates like compound interest

What if instead of projecting percentages, we project gigawatts from FERC’s December 2012 Installed Operating Generating Capacity table? Solar and wind still win in less than a decade.

FERC 2012 power source gigawatts and growth rates projected 20 years

Ignore the fastest-growing curve for a moment; I added that. All the other curves start with the December 2012 gigawatts for each power source in the FERC table, and an annual compound growth rate computed by comparing that installed operating capacity to the capacity added in 2012 for that power source. That compound annual growth rate for solar is 60.9% and for wind is 22.8%. Nothing else comes close.

Solar passes coal in about 8 years, wind in about 9, and natural gas in about Continue reading

Georgia Power to announce 20-year plan Thursday

What will Georgia Power announce for a 20 year energy plan Thursday? Will they (1) just double down on their rate-hike boondoggles for nuclear and gas, or (2) they could flip like 
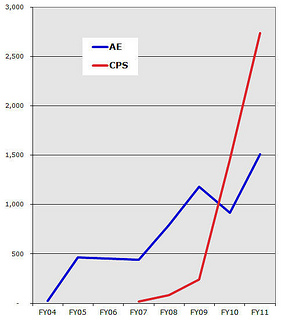
Austin Energy in 2003 and Cobb EMC in 2012 and suddenly go solar? The wording here looks like it’s going to be the former. That they even feel compelled to announce some sort of formal plan instead of just shovelling disinformation out another 50 years indicates they’re feeling the pressure to change direction 
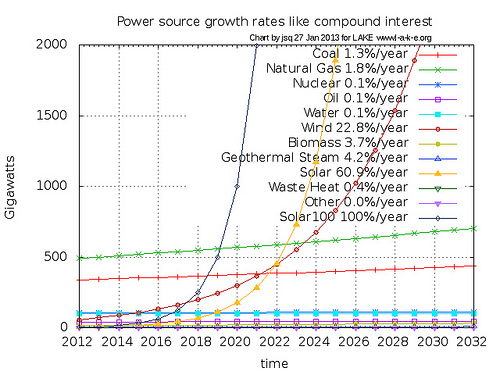
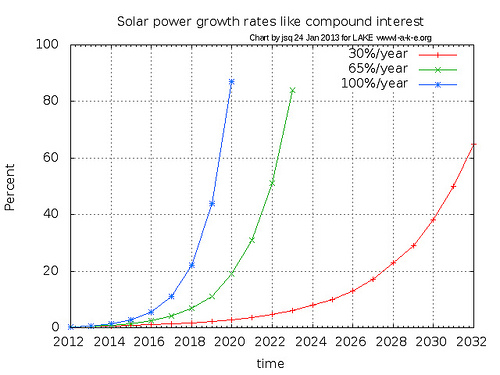
to real sustainable energy: wind and solar power.

Matt Shedd wrote for WUGATV today, Georgia Power To Release Energy Plan,

Georgia Power is set to release a 20-year energy plan on Thursday which will outline a way for the company and the state to be less reliant on coal power. The AJC reports that just 5 years ago, the company’s reliance on coal was at 70 percent.

That number has now dropped to 47 percent. These changes are coming in the wake of Georgia Power’s parent, the Southern Co., being pushed by environmental rules to rely less on coal. Georgia Power won approval to buy electricity produced by natural gas from its sister company Southern Power, which may be part of the company’s future plans.

Thomas A. Fanning, CEO of Georgia Power’s parent The Southern Company (SO), has been touting 70% to 35% reduction in coal since at least May 2012 at the SO shareholder meeting. Fanning continues to emphasize nuclear, gas, and “clean coal” instead of real sustainable energy, namely wind and solar power. He also continues to assert electricity demand will increase, while ignoring conservation and efficiency, which for Georgia could remove all need for new energy, enabling solar and wind to shut down more coal and gas plants, as well as nukes.

So, get out the popcorn and take your bets. Will it be (1) or will it be (2)? I’m betting this time it will be (1), but sooner or later it will be (2), and even Georgia Power, and yes, even Southern Company, will stop digging in their heels and get on the solar train to profits, jobs, energy independence, and oh, by the way, clean air and plenty of clean water.

-jsq

Dear Mr. Pritchard: How are we paying on something that was 100% paid off? —John S. Quarterman

I sent this today. -jsq

 
From: John S. Quarterman <questions@quarterman.com>
Cc: bslaughter@lowndescounty.com, jevans@lowndescounty.com, rraines@lowndescounty.com, cpowell@lowndescounty.com, dmarshall@lowndescounty.com, jpage@lowndescounty.com, questions@quarterman.com
Subject: How are we paying on something that was 100% paid off?

Dear Mr. Pritchard,

You may recall that at the Lowndes County Commission meeting of the 8th of January 2013, I asked the following:

“When this building complex was opened in 2010, the county put out a double-sheet flyer saying it was completely paid off out of SPLOST money, with zero dollars owed. I’m wondering how it is that then, either in November or December, the Commission just before your one here, refinanced bonds that included I think it was six or seven million dollars for this very building complex? I’m very confused by that. I wonder if someone could clarify how we’re paying on something that was completely 100% paid off with zero owed.”

I asked Commissioner Crawford Powell this question at the going-away reception for former Chairman Ashley Paulk on 14 December 2012, and he referred me to you for an answer. It has been more than two weeks since I asked in a Commission Regular Session and I have received no answer. So I ask again.

Specifically:

Continue reading

Rooftop solar: the most direct route to clean energy industries

Austin vs. San Antonio in solar power Around here I hear local leaders say “we’ll never be Austin.” Well, Austin may be letting San Antonio pass Austin as far as rooftop solar and the jobs that generates. It’s not a matter of size or pre-existing advantages. It’s a matter of political will. Do we have that will here?

TexasVox wrote a white paper in February 2012, Solar Austin: Rooftop Solar & Job Creation,

…the most direct route to attracting and encouraging the development of clean energy industries is through the

the scale of future development will be orders of magnitude greater than what has occurred to date.
mass deployment of local rooftop solar, which is probably why solar has by far the most significant presence of any clean energy generation technology in Austin.

But the paper’s point is that Austin is falling short. Look at the graph: Austin seems to have settled for linear growth in solar power, while San Antonio gets it about compound growth. As San Antonio Mayor Julian Castro said in 2011, solar power is in

Continue reading

Get a job —Lowndes County to waste site workers

Continuing to ignore its responsibilities to protect public health, safety, and well-being, the Lowndes County government proceeded with its plan to trash rural residents’ waste collection sites, and told part time workers there to get a job.

Jason Schaefer wrote for the VDT today, Trash centers dumped: Final week to make trips to county recycling centers,

The Lowndes County Board of Commissioners near the end of 2012 voted to approve a contract with Advanced Disposal to serve as the sole waste company to conduct curbside trash pick-up in unincorporated Lowndes County. Some citizens remain critical of the change in service, which will cost $12.80 per month, and many are trying to get their last loads to the collection/recycling centers before they close….

Full-time employees at the recycling stations, which are already employees of Public Works, said County Clerk Paige Dukes, will be moved to different positions within the department. Part-time employees will need to find new jobs.

Why might citizens be critical? Continue reading

I-75 as the Governor Melvin Ernest Thompson Memorial Highway?

Did you know the legislature is likely to rename much of Interstate 75 through Lowndes County in honor of a former governor, and spend $4,500 for signs to do so?

The Valdosta Daily Times, Lowndes County

NOTICE OF ROAD FACILITY DEDICATION

Notice is given that there will be introduced at the regular 2013 session of the General Assembly of Georgia a resolution sponsored by Senator Tim Golden, 121 State Capitol, Atlanta, Georgia 30334, (404) 656-7580, to dedicate the portion of Interstate 75 in Lowndes County from the West Hill Avenue exit to the North Valdosta Road exit as the Governor Melvin Ernest Thompson Memorial Highway in honor of his achievements, accomplishments, and contributions to Lowndes County and to the State of Georgia; and for other purposes. The estimated cost of such dedication is $4,500.00.

00046038

1/19/13

And such a bill has been introduced in the Georgia House (not the Senate) as HR 47, Governor Melvin Ernest Thompson Memorial Highway; Lowndes County; dedicate, sponsored by (1) Shaw, Jason 176th, (2) Carter, Amy 175th, (3) Black, Ellis 174th, (4) Sharper, Dexter 177th, (5) Houston, Penny 170th.

Here's the part that ties Gov. Thompson to here:

WHEREAS, Governor Thompson was instrumental in the success of the City of Valdosta and Lowndes County, where his leadership as a founding member of the Valdosta-Lowndes County Industrial Authority spearheaded much of the urban development and planning for Valdosta and the surrounding areas, including the Azalea City Industrial Park; and

And establishing Industrial Parks was a cutting-edge idea: in the 1950s.

The bill adds:

Continue reading

GA SB 51, The Georgia Cogeneration and Distributed Generation Act

Georgia Senator Buddy Carter has introduced a Senate bill for the current session of the legislature, SB 51, “The Georgia Cogeneration and Distributed Generation Act of 2001”. It attempts to fix Georgia’s special solar financing problem, the antique 1973 Territorial Electric Service Act.

Why 2001? Apparently Buddy Carter has been introducing it every year since then. Last year Georgia Power’s disinformation campaign nuked it when it was SB 401. Has the legislature gotten tired of Georgia Power and its parent the Southern Company being way late and overbudget on those new nukes? Does the legislature want Georgia citizens to get the savings and job benefits of the fastest growing energy source in the country? Will GaSU help with SB 51, or only with GaSU’s attempt to become a solar monopoly utility? You can contact your legislators and tell them what you think. Every one of them who voted for Georgia Power’s stealth-tax rate hike for that nuke boondoggle should vote for SB 51 to start getting Georgia on a clean path to jobs and energy independence.

This bill is not perfect: it counts “generator fueled by biomass” as Continue reading

Solar energy growth like compound interest

Some nuclear backers only want to look at the next table in that FERC report, Office of Energy Projects Energy Infrastructure Update For December 2012, which shows solar energy as 0.34% of total U.S. energy production, and then they stop thinking. But what about that 30% increase in solar power deployed between 2011 and 2012? Think of it like compound interest.

Total Installed Operating Generating Capacity
Installed Capacity (GW) % of Total Capacity % Growth 2011-2012
Coal 337.71 29.17% 1.3%
Natural Gas 491.82 42.48% 1.8%
Nuclear 107.01 9.24% 0.1%
Oil 41.32 3.57% 0.1%
Water 98.12 8.47% 0.1%
Wind 57.53 4.97% 22.8%
Biomass 15.00 1.30% 3.7%
Geothermal Steam 3.70 0.32% 4.2%
Solar 3.90 0.34% 60.9%
Waste Heat 0.69 0.06% 0.4%
Other 1.04 0.09% 0.0%
Total 1,157.86 100.00% 23.3%

Source: Data derived from Ventyx Global LLC, Velocity Suite.
Growth rates computed by jsq for LAKE www.l-a-k-e.org 24 January 2013.

Let’s look what happens if we assume 30% growth in solar power deployed per year:

Solar power growth rates like compound interest

At 30% annual growth, we’re up to solar as 50% of all generation within Continue reading

New U.S. energy in 2012 —FERC

What new energy sources are being deployed the fastest in the U.S.? According to FERC, the Federal Energy Regulatory Commission, it’s not what you may think. The big winners are coal, wind, and solar.

According to the report Office of Energy Projects Energy Infrastructure Update For December 2012, Coal, while accounting for only 17% of new capacity in 2012, unfortunately increased by 133% over new capacity installed in 2011. Natural gas did account for the second most new installed capacity in 2012, 33%, but the amount in megawatts installed actually decreased by 20% from 2011.

The most new capacity installed in 2012? Wind, at 40%, with a 56% increase over new installations in 2011. That’s right, wind beat natural gas 40% to 33% in total new capacity in 2012, and whomped gas in increase in new capacity in 2011, by 56% to -20%.

While solar only accounted for 5.59% of new capacity in 2012, that was an increase of 30% over new capacity in 2011, which is way more than gas and after only coal and wind.

New Generation In-Service (New Build and Expansion)
December 2012 January – December 2012 Cumulative January – December 2011 Cumulative Percent of Total New 2012 Percent Increase 2011- 2012
Primary Fuel Type No. of Units Installed Capacity (MW) No. of Units Installed Capacity (MW) No. of Units Installed Capacity (MW)
Coal 4 1,434 8 4,510 15 1,932 17.1% 133%
Natural Gas 6 2,306 94 8,746 108 11,020 33.1% -20.6%
Nuclear 0 0 1 125 0 0 0.474% -%
Oil 0 0 19 49 66 136 0.186% -64%
Water 2 4 13 99 41 94 0.375% 5.32%
Wind 45 3,095 164 10,689 146 6,844 40.5% 56.2%
Biomass 5 91 100 543 131 446 2.06% 21.7%
Geo- thermal Steam 2 9 13 149 9 56 0.565% 166%
Solar 16 77 240 1,476 354 1,131 5.59% 30.5%
Waste Heat 0 0 1 3 2 136 0.0114% -97.8%
Other 2 0 5 0 11 0 0% -%
Total 82 7,016 658 26,387 883 21,795 100% 21.1%

Source: Data derived from Ventyx Global LLC, Velocity Suite.
Last two columns added by jsq for LAKE www.l-a-k-e.org 24 January 2013.

Biomass unfortunately accounted for Continue reading

Hatch 1 nuclear reactor down to 40% power Sunday: why?

Why is Plant Hatch Unit 1 running at well below capacity? Saturday 19 Jan 2013 that nuclear plant was at 100%, according to the NRC, yet Sunday it was down to 45%, then 40% Monday and 64% today. What's going on at Hatch 1? And what happened to nuclear supposedly being 24/7?

There's no event report about this from the NRC; the last item the NRC has on Hatch 1 seems to be from 2003. Southern Company provides no information on this event. Another source (Platts, 4 January 2013) says Hatch 2 (and Vogtle 2) are to refuel in the first half of this year, among Fifty-six US nuclear units to shut for refueling in 2013. But Hatch 1 is not on that list, and a similar Hatch 1 brownout happened 5 and 6 January:

Continue reading