Tag Archives: compound

Power source growth rates like compound interest

What if instead of projecting percentages, we project gigawatts from FERC’s December 2012 Installed Operating Generating Capacity table? Solar and wind still win in less than a decade.

FERC 2012 power source gigawatts and growth rates projected 20 years

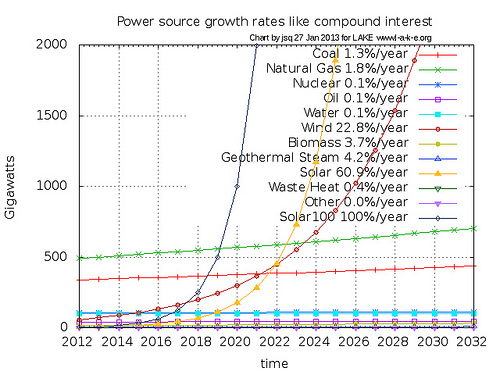
Ignore the fastest-growing curve for a moment; I added that. All the other curves start with the December 2012 gigawatts for each power source in the FERC table, and an annual compound growth rate computed by comparing that installed operating capacity to the capacity added in 2012 for that power source. That compound annual growth rate for solar is 60.9% and for wind is 22.8%. Nothing else comes close.

Solar passes coal in about 8 years, wind in about 9, and natural gas in about Continue reading

Solar energy growth like compound interest

Some nuclear backers only want to look at the next table in that FERC report, Office of Energy Projects Energy Infrastructure Update For December 2012, which shows solar energy as 0.34% of total U.S. energy production, and then they stop thinking. But what about that 30% increase in solar power deployed between 2011 and 2012? Think of it like compound interest.

Total Installed Operating Generating Capacity
Installed Capacity (GW) % of Total Capacity % Growth 2011-2012
Coal 337.71 29.17% 1.3%
Natural Gas 491.82 42.48% 1.8%
Nuclear 107.01 9.24% 0.1%
Oil 41.32 3.57% 0.1%
Water 98.12 8.47% 0.1%
Wind 57.53 4.97% 22.8%
Biomass 15.00 1.30% 3.7%
Geothermal Steam 3.70 0.32% 4.2%
Solar 3.90 0.34% 60.9%
Waste Heat 0.69 0.06% 0.4%
Other 1.04 0.09% 0.0%
Total 1,157.86 100.00% 23.3%

Source: Data derived from Ventyx Global LLC, Velocity Suite.
Growth rates computed by jsq for LAKE www.l-a-k-e.org 24 January 2013.

Let’s look what happens if we assume 30% growth in solar power deployed per year:

Solar power growth rates like compound interest

At 30% annual growth, we’re up to solar as 50% of all generation within Continue reading