Tag Archives: growth

Why Bezos started Amazon

Jeff Bezos sent his biographer to find the graphs; that’s when I learned about this. The Everything Store: Jeff Bezos and the Age of Amazon, Paperback, August 12, 2014, by Brad Stone (PDF, google book)

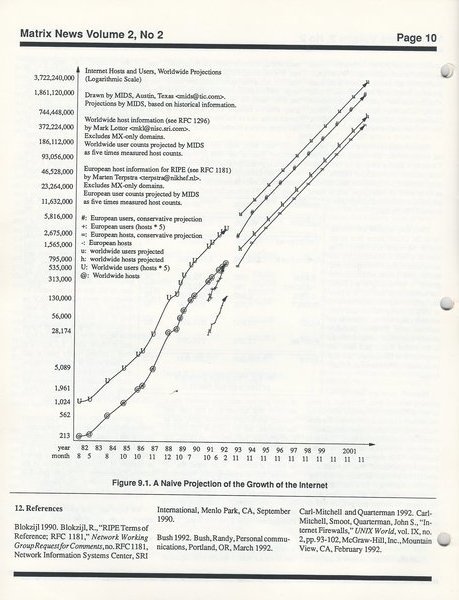
Intrigued by Shaw’s conviction about the inevitable importance of the Internet, Bezos started researching its growth. A Texas-based author and publisher named John Quarterman had recently started the Matrix News, a monthly newsletter extolling the Internet and discussing its commercial possibilities. One set of numbers in particular in the February 1994 edition of the newsletter was startling. For the first time, Quarterman broke down the growth of the year-old World Wide Web and pointed out that its simple, friendly interface appealed to a far broader audience than other Internet technologies. In one chart, he showed that the number of bytes—a set of binary digits —transmitted over the Web had increased by a factor of 2,057 between January 1993 and January 1994.

Internet Resource Discovery Services by Bytes
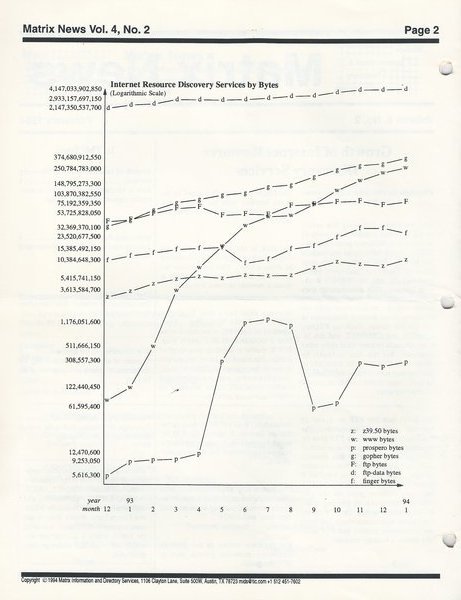
Internet Resource Discovery Services by Bytes, John S. Quarterman, Matrix News 4.2, MIDS, February 1994.

Another graphic showed Continue reading

A Naive Projection of the Growth of the Internet

Just as four years ago I projected solar growth ten years ahead, a quarter century ago I projected Internet growth ten years into the future:

A Naive Projection of the Growth of the Internet
Graph: A Naive Projection of the Growth of the Internet, John S. Quarterman, Matrix News 2.2, MIDS, February 1992.

From 7.7 million Internet users in 1992, I projected the exponential growth of the previous few years ahead a decade, to about 3.8 billion people in 2002.

How close was that estimate? Continue reading

Videos: Day 1, Planning, Lowndes County Commission @ LCC 2018-02-19

The 2018 Lowndes County Commission Retreat was just about the exact opposite of a commission meeting, except that same group of people are present (almost). There was discussion, disagreement, laughing, sighing, interrupting, listening, inside jokes, outside jokes, and general exchange of views. Those things don’t happen in a commission meeting. This year’s retreat was particularly different because there was no time frame attached to any agenda item and they didn’t discuss topics in exact order, and some topics got covered repeatedly. Commissioner Evans said to me during a break that the previous format of having departments just give a report can “get boring” and she had suggested that they have a different format with more discussion about communications.

The agenda was available on-line but was hard to find and the link I followed to find it is gone now. I did manage to download it before it went away. Find it here: 2018 LCC Annual Planning Meeting Agenda (plus searchable text). There were paper copies available at the meeting after the first break.

I sometimes think that the commissioners may be getting used to me but then, no, don’t be silly.

At the lunch hour, the Commissioners stepped outside to take a group picture and as County Clerk Page Dukes suggested that they get closer and not have so much “space” between them, Commissioners Orenstein and Griner (I live in their districts) huddled together.

Commissioners Gather Group Photo Close Group Photo
  Commissioners Orenstein and Griner

Below are links to each LAKE video, with a few notes followed by a LAKE video playlist. Continue reading

Solar power will win like the Internet did

Remember BITNET, FidoNet, or UUCP? Nope, the Internet overtook all of those. And in 20 years that’s how young people will remember coal and natural gas plants, although the waste-disposal costs of nukes will be with us for ten thousand years. Solar power is going to overtake all other power sources within a decade. Here’s why I think that.

Jerry Grillo quoted me in Georgia Trend July 2013, Sun Dancing: As Georgia’s solar capacity shoots skyward, a new state utility is proposed,

“Solar power is the fastest-growing industry in the world, and it’s growing along in the same way the Internet did,” says John S. Quarterman, a Harvard-educated author and Internet pioneer who launched the first commercial online newsletter, among other things, and who lives in rural Lowndes County.

“Think back 20 years to 1993. How many people had heard of the Internet? And look at how far we’ve come. What I’m seeing with solar energy is the same kind of exponential growth. It’s clean energy that works, and it generates jobs.”

Here are 1992 ten-year graphs of Internet growth from that newsletter, Matrix News, using Continue reading

Power source growth rates like compound interest

What if instead of projecting percentages, we project gigawatts from FERC’s December 2012 Installed Operating Generating Capacity table? Solar and wind still win in less than a decade.

FERC 2012 power source gigawatts and growth rates projected 20 years

Ignore the fastest-growing curve for a moment; I added that. All the other curves start with the December 2012 gigawatts for each power source in the FERC table, and an annual compound growth rate computed by comparing that installed operating capacity to the capacity added in 2012 for that power source. That compound annual growth rate for solar is 60.9% and for wind is 22.8%. Nothing else comes close.

Solar passes coal in about 8 years, wind in about 9, and natural gas in about Continue reading

Solar energy growth like compound interest

Some nuclear backers only want to look at the next table in that FERC report, Office of Energy Projects Energy Infrastructure Update For December 2012, which shows solar energy as 0.34% of total U.S. energy production, and then they stop thinking. But what about that 30% increase in solar power deployed between 2011 and 2012? Think of it like compound interest.

Total Installed Operating Generating Capacity
Installed Capacity (GW) % of Total Capacity % Growth 2011-2012
Coal 337.71 29.17% 1.3%
Natural Gas 491.82 42.48% 1.8%
Nuclear 107.01 9.24% 0.1%
Oil 41.32 3.57% 0.1%
Water 98.12 8.47% 0.1%
Wind 57.53 4.97% 22.8%
Biomass 15.00 1.30% 3.7%
Geothermal Steam 3.70 0.32% 4.2%
Solar 3.90 0.34% 60.9%
Waste Heat 0.69 0.06% 0.4%
Other 1.04 0.09% 0.0%
Total 1,157.86 100.00% 23.3%

Source: Data derived from Ventyx Global LLC, Velocity Suite.
Growth rates computed by jsq for LAKE www.l-a-k-e.org 24 January 2013.

Let’s look what happens if we assume 30% growth in solar power deployed per year:

Solar power growth rates like compound interest

At 30% annual growth, we’re up to solar as 50% of all generation within Continue reading

2012 solar deployments driven by Moore’s Law price reductions

Moore's Law in solar Watts/$100 Moore’s Law for solar is about decreasing price per Watt, or more Watts per dollar. Here’s an example of a common confusion, to think it’s about efficiency:

“The curve will obviously become asymptotic at some point, ie,. the rate of improvement will flatten out, so we end up with a sort of squashed “S” shape curve, because you can’t get more than 100% efficiency — 36 watts/m2 or so.”

And indeed efficiency probably will flatten out soon. But it’s not solar efficiency that’s improving by Moore’s Law: it’s price per watt. That can keep improving for a long time.

Here’s an example of decreasing price. Scott Detrow wrote for NPR 23 December 2012, Forget Fracking: 2012 Was A Powerful Year For Renewables,

Rhone Resch “Just to give you perspective,” Resh said, “in Washington, D.C., where I live, when I installed solar on my house six years ago, the average install cost was about $14 a watt. Today it’s about $4 a watt.”

Here’s another comparison, this one just for solar panels. KC 170 solar panels, purchased 2005 In 2005 the first set of solar panels we got cost $670 each and produced 170 Watts DC each, or $4.94/Watt. In 2011 our second set of solar panels cost $562 each for 235 Watts DC each, or $2.39/Watt. That’s more than 50% price decrease for solar panels in six years. (I can’t compare inverters or support structures directly, because those were sized so differently, but those have also come down in price, helping lower the overall install cost).

Yearprice /Wattprice /panelWatts /panel Dimens.square inchesWatts /100 sq in. Model
2005 $4.94 $670 170W 50×39″ 1950 8.7 KC 170
2011 $2.39 $562 235W 39.1×64.6″ 2525 9.3 Sharp ND 235 QCJ
2012 $1.32 $310 235W 39.1×64.6″ 2525 9.3 Sharp ND 235 QCJ

Meanwhile, the Watts per surface area hardly changed, from about Continue reading

What is Moore’s Law for solar power?

Many people are unfamiliar with Moore’s Law, and how it affects solar power. Moore’s Law doesn’t occur in many technologies or industries, but it’s there in solar photovoltaic (PV). For those of us whose whole working lives have been affected by Moore’s Law, seeing it turn up in another field is like a flashing neon sign pointing to the future. A future of distributed solar power sunrise over the crumbling industrial relics of coal, nuclear, and natural gas plants. A future with much less control by monopoly utilities, which is why they fight it. If they even see it coming; Bill Gates didn’t, back in the day, but Jeff Bezos of Amazon did. They both surfed that tide, and Moore’s Law made both of them among the richest humans on the planet while changing the world for all of us. Steve Jobs even used it to put a computer in your pocket more powerful than big companies could buy a few decades ago. What does Moore’s Law for solar power mean for electric power?

This chart shows the telltale symptom of Moore’s Law in solar electricity: 65% compound annual growth rate in solar power plants deployed for the past 5 years:

Source: Solar Power Graphs to Make You Smile by Zachary Shahan for CleanTechnica 10 June 2011.

As SunPower’s Dinwoodie puts it:

That 17 GW installed in 2010 is the equivalent of 17 nuclear power plants — manufactured, shipped and installed in one year. It can take decades just to install a nuclear plant. Think about that. I heard Bill Gates recently call solar “cute.” Well, that’s 17 GW of “cute” adding up at an astonishing pace.

Bill Gates should recall that Moore’s Law made formerly “cute” PCs with his “cute” operating system Windows expand into every company in the world and made him the second richest human on the planet. Growth of computer software markets, like for the U.S. as shown in the graph on the right, is a symptom of the original Moore’s Law. Software runs on hardware, and these hardware market curves are driven more directly by Moore’s Law:

Continue reading

2/3 of new European electrical capacity comes from solar and wind

If Europe can deploy mostly solar and wind for new electricity, we can do the same here, especially in sunny south Georgia.

Stephen Lacey wrote for Climate Progress 12 Feb 2012, More than 68% of New European Electricity Capacity Came From Wind and Solar in 2011,

That’s almost a 10-fold increase over deployment in 2000, when only 3.5 GW of renewable energy projects were installed. Last year, 32 GW of renewables — mostly wind and solar — were deployed across European countries.
If Europe can change its energy strategy that quickly, so can we.

-jsq

PS: Owed to William House.

Baltimore’s place-based model

Growth isn’t everything, and vacant lots can be leveraged to deal with food disparity and obesity, Baltimore is demonstrating.

Vanessa Barrington wrote for Grist 21 November 2011, Baltimore’s can-do approach to food justice

…43 percent of the residents in the city’s predominantly black neighborhoods had little access to healthy foods, compared to 4 percent in predominantly white neighborhoods. Meanwhile, more than two-thirds of the city’s adults and almost 40 percent of high school students are overweight or obese.
That’s the problem.

There are solutions:

Speaking on a panel at the recent Community Food Security Coalition Conference in Oakland, Calif., Abby Cocke, of Baltimore’s Office of Sustainability, and Laura Fox, of the city health department’s Virtual Supermarket Program, outlined two approaches to address the city’s food deserts. Both were presenting programs that have launched since Grist last reported on Baltimore’s efforts to address food justice. And both programs come under the auspices of The Baltimore Food Policy Initiative, a rare intergovernmental collaboration between the city’s Department of Planning, Office of Sustainability, and Health Department. They also show how an active, involved city government and a willingness to try new ideas can change the urban food landscape for the better.

According to Cocke, Baltimore’s Planning Department has a new mindset. She calls it a “place-based” model. “In the past,” she says, “growth was seen as the only way to improve the city, but we’re starting to look at ways to make our neighborhoods stronger, healthier, and more vibrant places at the low density that they’re at now.”

The article outlines the specific solutions, such as: Continue reading