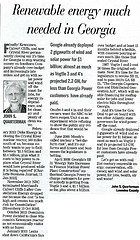
Instead of demonstrating to influence legislators, sometimes it's better
to get elected and legislate: that's what Kyle Jones did in Maine,
and he closed the Maine Yankee nuke,
de-monopolized the state's electrical utilities,
and instituted a 30% renewable energy goal.
All this was helped by the nuclear industry's own incompetence.
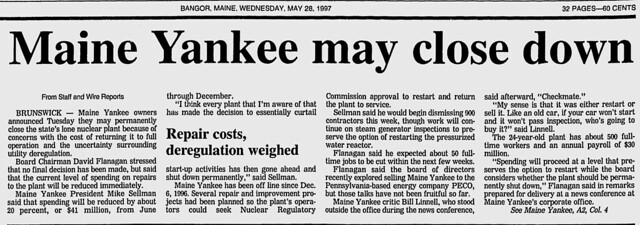
Bangor Daily News, Page A2, 28 May 1997,
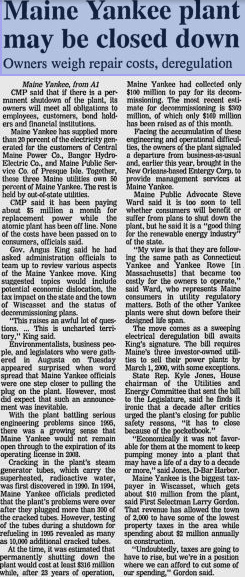
Maine Yankee plant may be closed down: Owners weigh repair costs, deregulation,
 Cracking in the plant's steam generator tubes, which carry the superheated,
radioactive water, was first discovered in 1990.
In 1994, Main Yankee officials predicted that the plant's problems
were over after they plugged more than 300 of the cracked tubes.
However, testing of the tubes during a shutdown for refueling in 1995
revealed as many as 10,000 additional cracked tubes.
Cracking in the plant's steam generator tubes, which carry the superheated,
radioactive water, was first discovered in 1990.
In 1994, Main Yankee officials predicted that the plant's problems
were over after they plugged more than 300 of the cracked tubes.
However, testing of the tubes during a shutdown for refueling in 1995
revealed as many as 10,000 additional cracked tubes.
Sounds a lot like
San Onofre.
At the time, it was estimated that permanently shutting down
the plant would cost at least $316 million while,
after 23 years of operation, Maine Yankee had collected only
$100 million to pay for its decommissioning. The most recent
estimate for decommissioning is $369 million, of which
only $169 million has been raised as of this month.
Facing the accumulation of these engineering and operational difficulties,
the owners of the plant signaled a departure from business-as-usual
and, earlier this year, brought in the New Orleans-based Entergy Corp.
to provide management services at Maine Yankee.
Oh, my!
The same Entergy that's now
likely to close Vermont Yankee.
And Vermont Yankee wasn’t the first to follow this financial path to closure:
Continue reading →
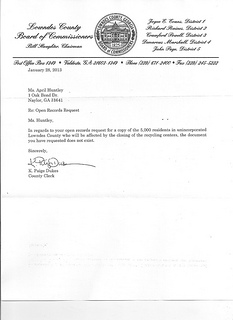
for the closure of Old State Rd. tabled until next meeting! I hope we will all be able to work together to find a lasting solution that will enable the residents of Lowndes County and surrounding areas to continue to enjoy this beautiful spot on the Alapaha River. I hope you agree that this is not a standard road abandonment since it affects a body of water. I hope you have a great day, and I look forward to speaking with you soon!