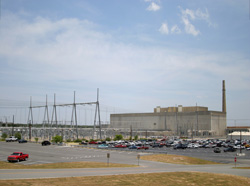
Will Georgia Power CEO Paul Bowers say this tritium leak at Plant Hatch
is not a problem, like he did
about the one in September 2011?
Meanwhile, how many tritium leaks have you heard of from solar
panels or wind mills?
According to the NRC’s Event Notification Report for February 14, 2013,
OFFSITE NOTIFICATION DUE TO TRITIUM RELEASE ONSITE,
“As part of routine rounds on 2/13/13, site personnel discovered an
 overflow condition at a collection tank containing water with low
levels of tritium (approximately 6,000 pCi/L). The discharge pump
for the tank was found to be nonfunctional which resulted in the
overflow condition. Following discovery, a portable pump was
utilized to pump the water to the normal monitored discharge path
and terminate the overflow condition. The exact volume could not be
determined but it is estimated that the volume of water that
overflowed to the ground was greater than the 100 gallon threshold
for voluntary reporting as indicated in Nuclear Energy Institute
(NEI) 07-07, ‘Industry Ground Water Initiative-Final Guidance
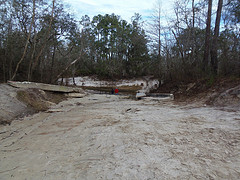
Document.’ A rough estimate of the release is between 100 and 300
gallons. The tritium was contained to a small area on the plant site
in the vicinity of the discharge structure, and there is no
significant potential for off-site impact or impact to on-site
personnel.
overflow condition at a collection tank containing water with low
levels of tritium (approximately 6,000 pCi/L). The discharge pump
for the tank was found to be nonfunctional which resulted in the
overflow condition. Following discovery, a portable pump was
utilized to pump the water to the normal monitored discharge path
and terminate the overflow condition. The exact volume could not be
determined but it is estimated that the volume of water that
overflowed to the ground was greater than the 100 gallon threshold
for voluntary reporting as indicated in Nuclear Energy Institute
(NEI) 07-07, ‘Industry Ground Water Initiative-Final Guidance
Document.’ A rough estimate of the release is between 100 and 300
gallons. The tritium was contained to a small area on the plant site
in the vicinity of the discharge structure, and there is no
significant potential for off-site impact or impact to on-site
personnel.
“Because the leak remained on site, there will be no offsite impact
to drinking water sources. Furthermore, the release posed no threat
to employees or the public. Southern Nuclear [SNC] will continue to
monitor the affected area as required.
Sure, and
they’ve got a ten-mile-radius emergency plan for Plant Hatch, too!
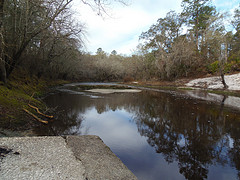
Nevermind the Floridan Aquifer that underlies the whole coastal plain hereabouts,
and that we drink from over here, only 100 miles from Plant Hatch.
The report says they’ll report to the state:
Continue reading →