Why am I so sure that I will live to see fracked methane pipelines shut down, along with their tar sands and petroleum partners in crime? Because I’ve seen it before, a quarter century ago, when the Internet won over all other networks, including BITNET.
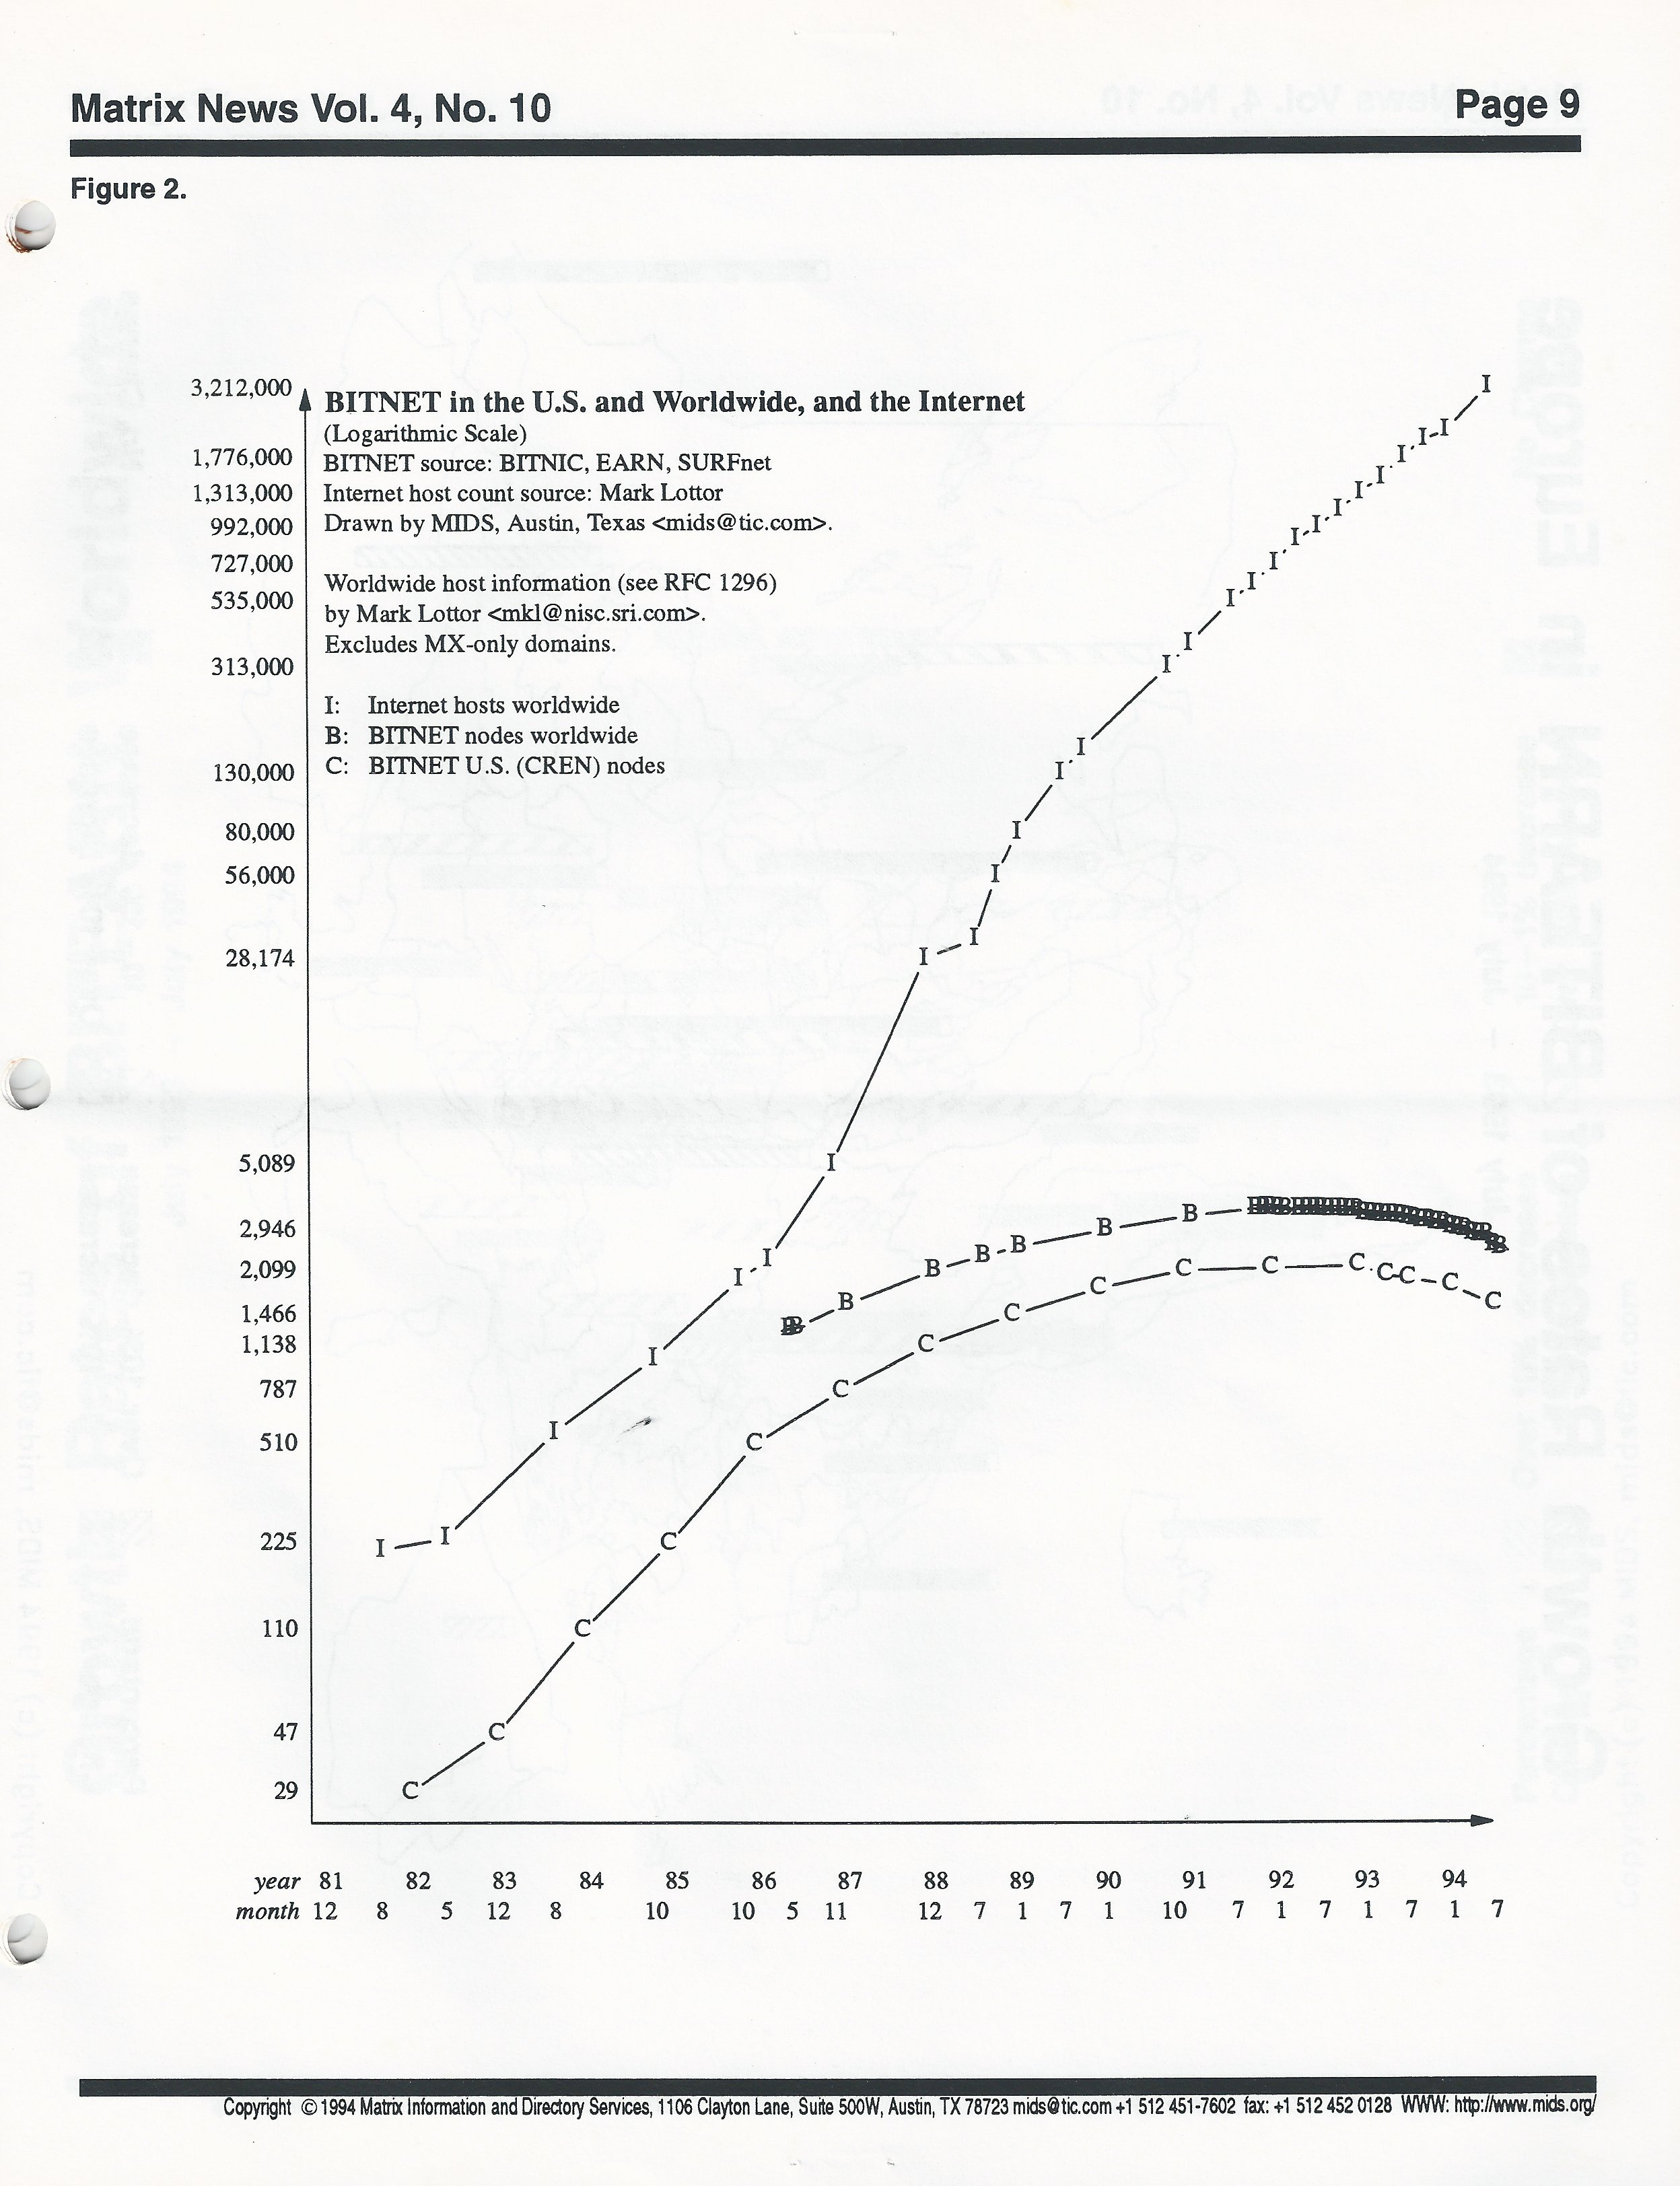
BITNET in the U.S. and Worldwide and the Internet,
in
Matrix News 4.10 October 1994.
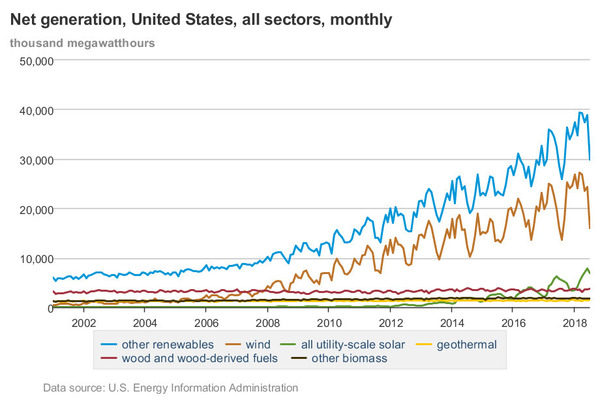
The exponential growth of the Internet sucked users away from all the other networks. Coal is already crashing so fast that cleaning up coal ash is the biggest issue. Nukes are closing left and right. “Natural” gas is still growing, but not as fast as solar and wind, which produced more new electricity than any other source in 2020. Soon, fracked methane will peak, and then it will fall fast, just like coal did. The bigger they are, the harder they fall.
Solar, wind, batteries and other storage will continue to soar until almost all electricity comes from them. A cleaner world, with profit for those who buy in, and lower power charges for everyone: it’s coming fast.
Vote for clean energy and help it arrive faster.
Remember FidoNet? Probably you’ve never heard of it, and this is why. Remember BITNET? Maybe not, but one of its neologisms lingers on: Continue reading