Why are all these “dependable” baseload capacity nukes down so much?
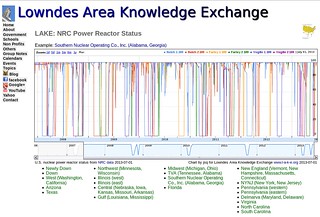 See for yourself in these interactive graphs of
NRC Power Reactor Status.
They’re in Google annotated timeline format,
with all the zoom and pan features used by Google finance for stock charts.
But these
Reactor Status charts show seven years of
daily NRC power percentage data.
Want to see last month, six months, any 7 days, or some other period?
Now you can, for all 104 reactors, including
the ones recently removed by NRC from status because they’ve closed
permanently.
See for yourself in these interactive graphs of
NRC Power Reactor Status.
They’re in Google annotated timeline format,
with all the zoom and pan features used by Google finance for stock charts.
But these
Reactor Status charts show seven years of
daily NRC power percentage data.
Want to see last month, six months, any 7 days, or some other period?
Now you can, for all 104 reactors, including
the ones recently removed by NRC from status because they’ve closed
permanently.
You can view your own local reactors in any of 20 charts. Why so many graphs? Google annotated timeline charts apparently were meant for comparing a few stock prices, and don’t handle more than about seven curves well. But you can see things in these graphs that are hard to spot in NRC’s daily tables.
Example: Southern Nuclear Operating Co., Inc. (Alabama, Georgia)
|
U.S. nuclear power reactor status from NRC data 2013-07-01 |
Chart by jsq for Lowndes Area Knowledge Exchange www.l-a-k-e.org 2013-07-01 |
Look at
Southern Company’s reactors,
Farley, Hatch, and Vogtle (two reactors each), for the past six months.
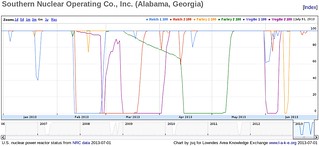 Hatch 1 dipped to 40% on 21 January, Hatch 1 went down on 11 Feb
for almost a week,
Hatch 2 followed one day later on 12 Feb and stayed down for more than a
month.
So both Hatch 1 and 2 were down 12-25 February.
Hatch 1 dipped to 40% on 21 January, Hatch 1 went down on 11 Feb
for almost a week,
Hatch 2 followed one day later on 12 Feb and stayed down for more than a
month.
So both Hatch 1 and 2 were down 12-25 February.
Vogtle 2 was down 27-28 Feb and never made it back to full power before it was at zero again 11 March through 2 April. Farley 2 drizzled down a few percent a day starting 12 March, dropping to zero 15 April through 8 May. Vogtle 2 was down again 2-7 June. Farley 1 was down 12-13 June. This is reliability?
Sure, solar power fades a bit when it’s cloudy, but it’s seldom cloudy
 everywhere at the same time for long, and
a cloudy day doesn’t last an entire month.
everywhere at the same time for long, and
a cloudy day doesn’t last an entire month.
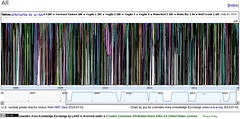
My personal favorite is the chart of all 104 reactors, zoomed way out. If nuclear power is so reliable, why is at least one of them almost always down?
 Maybe we should
get on with solar and wind through a smart grid instead.
Maybe we should
get on with solar and wind through a smart grid instead.
-jsq
Short Link: