Why are all these “dependable” baseload capacity nukes down so much?
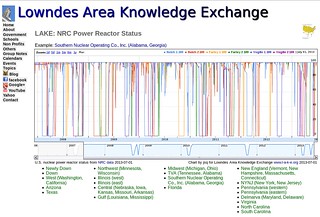
See for yourself in these interactive graphs of
NRC Power Reactor Status.
They’re in Google annotated timeline format,
with all the zoom and pan features used by Google finance for stock charts.
But these
Reactor Status charts show seven years of
daily NRC power percentage data.
Want to see last month, six months, any 7 days, or some other period?
Now you can, for all 104 reactors, including
the ones recently removed by NRC from status because they’ve closed
permanently.
You can view your own local reactors
in any of 20 charts.
Why so many graphs? Google annotated timeline charts apparently were
meant for comparing a few stock prices, and don’t handle more than about
seven curves well.
But you can see things in these graphs that are hard to spot in
NRC’s daily tables.