Citizen dialog for transparent process by the Lowndes Area Knowledge Exchange
Nuclear reactor percent power from NRC data
Do nuclear reactors really deliver dependable baseload capacity?
I hear industry execs say 99.99% uptime.
The real average from seven years of NRC data for 104 reactors is 88.13%.
According to Power Reactor Status Reports
posted online by the Nuclear Regulatory Commission,
here are the actual percent power percentages over time
for the 104 listed nuclear power reactors.
The timeframe is 31 March 2006 through today, 21 May 2013.
(The NRC data appears to go back to 1999, but seven years
is a good sample to start with.)
The computation for each reactor is the sum of the uptime
percentages for each day divided by the number of days.
The total uptime is the sum of the reactor uptimes divided
by the number of reactors.
Here’s the list, sorted two ways:
Alphabetical
92.94
Beaver Valley 1
91.23
Beaver Valley 2
93.31
Calvert Cliffs 1
93.82
Calvert Cliffs 2
91.32
FitzPatrick
93.21
Ginna
92.40
Hope Creek 1
92.64
Indian Point 2
92.58
Indian Point 3
94.63
Limerick 1
93.52
Limerick 2
88.61
Millstone 2
90.87
Millstone 3
91.89
Nine Mile Point 1
92.02
Nine Mile Point 2
89.70
Oyster Creek
93.78
Peach Bottom 2
95.06
Peach Bottom 3
91.96
Pilgrim 1
91.35
Salem 1
90.95
Salem 2
86.74
Seabrook 1
84.07
Susquehanna 1
85.47
Susquehanna 2
92.76
Three Mile Island 1
91.82
Vermont Yankee
73.40
Browns Ferry 1
86.48
Browns Ferry 2
87.34
Browns Ferry 3
88.66
Brunswick 1
86.03
Brunswick 2
89.48
Catawba 1
91.25
Catawba 2
45.73
Crystal River 3
91.01
Farley 1
91.30
Farley 2
91.76
Harris 1
90.81
Hatch 1
87.30
Hatch 2
89.66
McGuire 1
89.45
McGuire 2
89.10
North Anna 1
86.34
North Anna 2
87.13
Oconee 1
93.02
Oconee 2
91.11
Oconee 3
86.37
Robinson 2
83.53
Saint Lucie 1
79.01
Saint Lucie 2
90.94
Sequoyah 1
89.53
Sequoyah 2
88.35
Summer
92.04
Surry 1
91.02
Surry 2
81.15
Turkey Point 3
83.49
Turkey Point 4
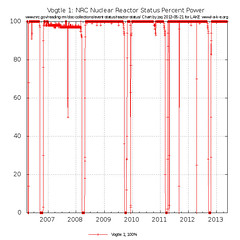
91.61
Vogtle 1
91.51
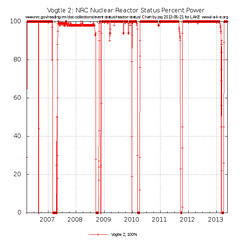
Vogtle 2
86.36
Watts Bar 1
93.94
Braidwood 1
94.34
Braidwood 2
92.76
Byron 1
93.73
Byron 2
91.98
Clinton
72.10
D.C. Cook 1
89.71
D.C. Cook 2
86.48
Davis-Besse
94.15
Dresden 2
94.10
Dresden 3
89.54
Duane Arnold
79.30
Fermi 2
89.17
Kewaunee
94.40
La Salle 1
94.77
La Salle 2
85.28
Monticello
86.72
Palisades
83.90
Perry 1
89.37
Point Beach 1
88.39
Point Beach 2
87.47
Prairie Island 1
89.94
Prairie Island 2
92.12
Quad Cities 1
92.58
Quad Cities 2
90.33
Arkansas Nuclear 1
91.06
Arkansas Nuclear 2
89.61
Callaway
83.05
Columbia Generating Station
92.86
Comanche Peak 1
94.48
Comanche Peak 2
89.19
Cooper
91.37
Diablo Canyon 1
87.55
Diablo Canyon 2
61.42
Fort Calhoun
86.42
Grand Gulf 1
83.18
Palo Verde 1
87.87
Palo Verde 2
85.98
Palo Verde 3
87.12
River Bend 1
66.01
San Onofre 2
65.15
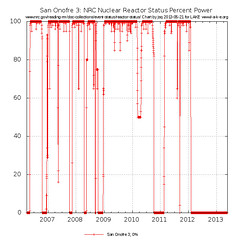
San Onofre 3
91.73
South Texas 1
83.71
South Texas 2
88.39
Waterford 3
82.89
Wolf Creek 1
88.13
All 104 reactors
Percent power
95.06
Peach Bottom 3
94.77
La Salle 2
94.63
Limerick 1
94.48
Comanche Peak 2
94.40
La Salle 1
94.34
Braidwood 2
94.15
Dresden 2
94.10
Dresden 3
93.94
Braidwood 1
93.82
Calvert Cliffs 2
93.78
Peach Bottom 2
93.73
Byron 2
93.52
Limerick 2
93.31
Calvert Cliffs 1
93.21
Ginna
93.02
Oconee 2
92.94
Beaver Valley 1
92.86
Comanche Peak 1
92.76
Three Mile Island 1
92.76
Byron 1
92.64
Indian Point 2
92.58
Quad Cities 2
92.58
Indian Point 3
92.40
Hope Creek 1
92.12
Quad Cities 1
92.04
Surry 1
92.02
Nine Mile Point 2
91.98
Clinton
91.96
Pilgrim 1
91.89
Nine Mile Point 1
91.82
Vermont Yankee
91.76
Harris 1
91.73
South Texas 1
91.61
Vogtle 1
91.51
Vogtle 2
91.37
Diablo Canyon 1
91.35
Salem 1
91.32
FitzPatrick
91.30
Farley 2
91.25
Catawba 2
91.23
Beaver Valley 2
91.11
Oconee 3
91.06
Arkansas Nuclear 2
91.02
Surry 2
91.01
Farley 1
90.95
Salem 2
90.94
Sequoyah 1
90.87
Millstone 3
90.81
Hatch 1
90.33
Arkansas Nuclear 1
89.94
Prairie Island 2
89.71
D.C. Cook 2
89.70
Oyster Creek
89.66
McGuire 1
89.61
Callaway
89.54
Duane Arnold
89.53
Sequoyah 2
89.48
Catawba 1
89.45
McGuire 2
89.37
Point Beach 1
89.19
Cooper
89.17
Kewaunee
89.10
North Anna 1
88.66
Brunswick 1
88.61
Millstone 2
88.39
Waterford 3
88.39
Point Beach 2
88.35
Summer
87.87
Palo Verde 2
87.55
Diablo Canyon 2
87.47
Prairie Island 1
87.34
Browns Ferry 3
87.30
Hatch 2
87.13
Oconee 1
87.12
River Bend 1
86.74
Seabrook 1
86.72
Palisades
86.48
Browns Ferry 2
86.48
Davis-Besse
86.42
Grand Gulf 1
86.37
Robinson 2
86.36
Watts Bar 1
86.34
North Anna 2
86.03
Brunswick 2
85.98
Palo Verde 3
85.47
Susquehanna 2
85.28
Monticello
84.07
Susquehanna 1
83.90
Perry 1
83.71
South Texas 2
83.53
Saint Lucie 1
83.49
Turkey Point 4
83.18
Palo Verde 1
83.05
Columbia Generating Station
82.89
Wolf Creek 1
81.15
Turkey Point 3
79.30
Fermi 2
79.01
Saint Lucie 2
73.40
Browns Ferry 1
72.10
D.C. Cook 1
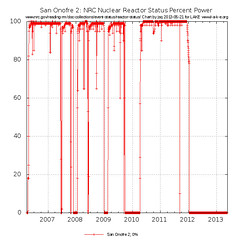
66.01
San Onofre 2
65.15
San Onofre 3
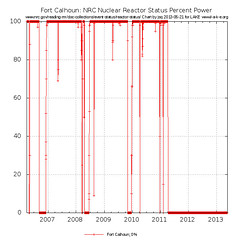
61.42
Fort Calhoun
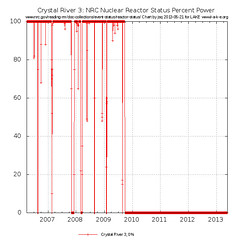
45.73
Crystal River 3
88.13
All 104 reactors
Worst of the lot is Crystal River 3, down since 2009,
and
Duke finally decided in February to close it for good.
Fort Calhoun is next worst, down since 2011, and several times before that.
Both San Onofre nukes have been down since 2012, and multiple times before that.
Maybe one could argue that it’s not fair to include reactors down for
years in an average of active reactors.
Seems to me if it’s fair to charge Georgia Power customers for
Plant Vogtle units 3 and 4,
still not delivering any power and
19 months late and a billion over budget,
it’s fair to include reactors that are supposed to be active yet are shut down.
If big baseload is so great, why aren’t they working?
But we can go around that question altogether.
Look at Georgia Power and Southern Company’s flagship reactors:
Vogtle 1 at 91.61% and Vogtle 2 at 91.51%.
Now those aren’t bad uptimes.
But they aren’t the 99.99+% uptimes I hear industry execs claim.
Look at SO’s Hatch 1 at 90.81% and Hatch 2 at 87.30%.
Not looking so good.
And next door in Alabama, Farley 1 shows 91.01% and Farley 2 at 91.30%.
Like Vogtle, not bad, but no multiple sigmas for Farley.
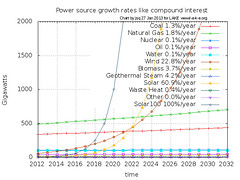
Southern Company and Georgia Power and Entergy and all the other
big baseload power companies can keep trying to sell their mainframes
in a mobile phone world, but
the utilities that turn distributed solar power into an advantage
for them
will win the Super Bowl of power generation.
And the rest will have, ah, problems.
 According to Power Reactor Status Reports
posted online by the Nuclear Regulatory Commission,
here are the actual percent power percentages over time
for the 104 listed nuclear power reactors.
The timeframe is 31 March 2006 through today, 21 May 2013.
(The NRC data appears to go back to 1999, but seven years
is a good sample to start with.)
The computation for each reactor is the sum of the uptime
percentages for each day divided by the number of days.
The total uptime is the sum of the reactor uptimes divided
by the number of reactors.
Here’s the list, sorted two ways:
According to Power Reactor Status Reports
posted online by the Nuclear Regulatory Commission,
here are the actual percent power percentages over time
for the 104 listed nuclear power reactors.
The timeframe is 31 March 2006 through today, 21 May 2013.
(The NRC data appears to go back to 1999, but seven years
is a good sample to start with.)
The computation for each reactor is the sum of the uptime
percentages for each day divided by the number of days.
The total uptime is the sum of the reactor uptimes divided
by the number of reactors.
Here’s the list, sorted two ways:
 Worst of the lot is Crystal River 3, down since 2009,
and
Duke finally decided in February to close it for good.
Fort Calhoun is next worst, down since 2011, and several times before that.
Both San Onofre nukes have been down since 2012, and multiple times before that.
Worst of the lot is Crystal River 3, down since 2009,
and
Duke finally decided in February to close it for good.
Fort Calhoun is next worst, down since 2011, and several times before that.
Both San Onofre nukes have been down since 2012, and multiple times before that.
 But we can go around that question altogether.
Look at Georgia Power and Southern Company’s flagship reactors:
Vogtle 1 at 91.61% and Vogtle 2 at 91.51%.
Now those aren’t bad uptimes.
But they aren’t the 99.99+% uptimes I hear industry execs claim.
But we can go around that question altogether.
Look at Georgia Power and Southern Company’s flagship reactors:
Vogtle 1 at 91.61% and Vogtle 2 at 91.51%.
Now those aren’t bad uptimes.
But they aren’t the 99.99+% uptimes I hear industry execs claim.
 Look at SO’s Hatch 1 at 90.81% and Hatch 2 at 87.30%.
Not looking so good.
Look at SO’s Hatch 1 at 90.81% and Hatch 2 at 87.30%.
Not looking so good.
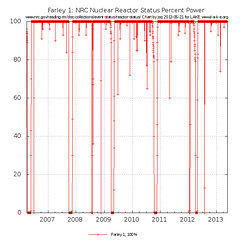
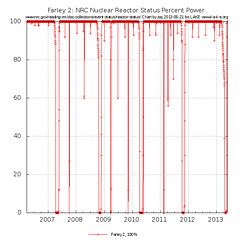 And next door in Alabama, Farley 1 shows 91.01% and Farley 2 at 91.30%.
Like Vogtle, not bad, but no multiple sigmas for Farley.
And next door in Alabama, Farley 1 shows 91.01% and Farley 2 at 91.30%.
Like Vogtle, not bad, but no multiple sigmas for Farley.
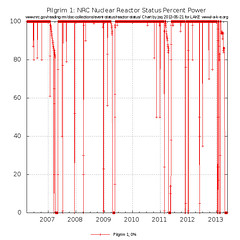 So big baseload nuclear is not as good as its operators claim.
Entergy
can’t even keep Pilgrim 1 running during a snowstorm,
or keep the power on during the Super Bowl.
So big baseload nuclear is not as good as its operators claim.
Entergy
can’t even keep Pilgrim 1 running during a snowstorm,
or keep the power on during the Super Bowl.
 Southern Company and Georgia Power and Entergy and all the other
big baseload power companies can keep trying to sell their mainframes
in a mobile phone world, but
the utilities that turn distributed solar power into an advantage
for them
will win the Super Bowl of power generation.
And the rest will have, ah, problems.
Southern Company and Georgia Power and Entergy and all the other
big baseload power companies can keep trying to sell their mainframes
in a mobile phone world, but
the utilities that turn distributed solar power into an advantage
for them
will win the Super Bowl of power generation.
And the rest will have, ah, problems.