Peak power when you need it: solar.
Somebody has been studying it, and addressing problems
local decisionmakers right here in south Georgia have been raising.
Solar Power Generation in the US:
Too expensive, or a bargain?
by
Richard Perez, ASRC, University at Albany,
Ken Zweibel, GW Solar Institute, George Washington University,
Thomas E. Hoff, Clean Power Research.
That’s Albany, New York, but it applies even more to Albany, Georgia
and Lowndes County, Georgia, since we’re so much farther south,
with much more sun.
Let’s cut to the chase:
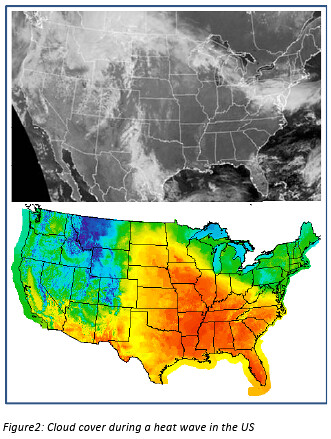 The fuel of heat waves is the sun; a heat wave cannot take place without a
massive local solar energy influx. The bottom part of Figure 2 illustrates
an example of a heat wave in the southeastern US in the spring of 2010
and the top part of the figure shows the cloud cover at the same time:
the qualitative agreement between solar availability and the regional
heat wave is striking. Quantitative evidence has also shown that the
mean availability of solar generation during the largest heat wave
driven rolling blackouts in the US was nearly 90% ideal (Letendre et
al. 2006). One of the most convincing examples, however, is the August
2003 Northeast blackout that lasted several days and cost nearly $8
billion region wide (Perez et al., 2004). The blackout was indirectly
caused by high demand, fueled by a regional heat wave3. As little as 500
MW of distributed PV region wide would have kept every single cascading
failure from feeding into one another and precipitating the outage. The
analysis of a similar subcontinental scale blackout in the Western US
a few years before that led to nearly identical conclusions (Perez et
al., 1997).
The fuel of heat waves is the sun; a heat wave cannot take place without a
massive local solar energy influx. The bottom part of Figure 2 illustrates
an example of a heat wave in the southeastern US in the spring of 2010
and the top part of the figure shows the cloud cover at the same time:
the qualitative agreement between solar availability and the regional
heat wave is striking. Quantitative evidence has also shown that the
mean availability of solar generation during the largest heat wave
driven rolling blackouts in the US was nearly 90% ideal (Letendre et
al. 2006). One of the most convincing examples, however, is the August
2003 Northeast blackout that lasted several days and cost nearly $8
billion region wide (Perez et al., 2004). The blackout was indirectly
caused by high demand, fueled by a regional heat wave3. As little as 500
MW of distributed PV region wide would have kept every single cascading
failure from feeding into one another and precipitating the outage. The
analysis of a similar subcontinental scale blackout in the Western US
a few years before that led to nearly identical conclusions (Perez et
al., 1997).
In essence, the peak load driver, the sun via heat waves and A/C demand,
is also the fuel powering solar electric technologies. Because of this
natural synergy, the solar technologies deliver hard wired peak shaving
capability for the locations/regions with the appropriate demand mix
peak loads driven by commercial/industrial A/C that is to say, much
of America. This capability remains significant up to 30% capacity
penetration (Perez et al., 2010), representing a deployment potential
of nearly 375 GW in the US.
The sun supplies solar power when you need it:
at the same time the sun drives heat waves.
The paper identifies the problem I’ve encountered talking to local
policy makers, especially ones associated with power companies:
Continue reading →
 Copies of the Analysis of Impediments to Fair Housing, City of Valdosta, are now available for 2006 and December 2011 on the LAKE website. I retrieved both of them today from Document Central on the the City of Valdosta’s Document Central. It is my understanding that the 2006 version has been there for some time, and the 2011 version was put there today. The 2011 version is a draft that has not yet been approved by HUD.