According to FERC’s own figures from 2012 and 2016,
my solar projections from 2013 (and former FERC Chair Jon Wellinghoff’s) were pretty good,
and more U.S. electricity will still come from solar power by 2023.
 Since coal and nuclear are already crashing, and natural gas isn’t
increasing even as fast as formerly projected, solar could win even faster.
Since coal and nuclear are already crashing, and natural gas isn’t
increasing even as fast as formerly projected, solar could win even faster.
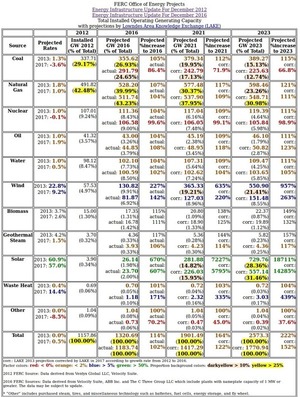
I constructed table below from the 2012 and 2016 summaries of total U.S. electric power generation from all sources, by the Federal Energy Regulatory Commission (FERC).
Look at the 2012 column: only coal and natural gas generated more than 25% of total U.S. electricity.
But in 2016 it’s only natural gas, because coal’s growth rate actually turned negative: utilities are shutting down coal plants, not building them. Back in 2013 I did not predict that to happen so quickly.
Now look at
the growth rates,
 both Continue reading

