
In a year solar jobs increased more than 20% to 142,000,
according to the
National Solar Jobs Census 2013.
Let’s remember Politifact Rhode Island rated as true
Senator Sheldon Whitehouse’s claim that
there are already more solar jobs than coal mining jobs.
And already last year there were
more solar jobs than in production and nonsupervisory oil and gas extraction.
That was 119,000 solar jobs according to the
National Solar Jobs Census 2012
by the Solar Foundation; thus the 20% increase.
Meanwhile, “production and nonsupervisory employees” in the oil and
gas extraction industry increased 4% from 106,400 in September 2013 to
110,600 in September 2014, according to
Oil and Gas Extraction: NAICS 211 by the U.S. Bureau of Labor Statistics.
Total oil and gas industry employment increased 8% from
197,500 to 213,100 in the same period.
Of course, we really should be using the 2013 (not 2014) oil and gas figures
to compare to the Solar Jobs Census 2013,
so those 142,000 solar jobs would be 33% more than the 106,400 nonmanagerial
oil and gas extraction jobs, and 72% of the total 197,500 oil and gas jobs.
But oil and gas jobs are growing
so slowly it doesn’t really matter which year:
they might as well be standing still while solar jobs soar upwards.
And the solar employment picture just keeps getting more sunny.
Ehren Goossens, Bloomberg News, 27 January 2014,
U.S. Solar Jobs Grow 20% to More Than 142,000 Last Year,
The survey of more than 15,000 employers found 23,682 jobs were
added, with installation accounting for about half of the industry’s
142,698 workers, the nonprofit Solar Foundation concluded in a
report posted on its website today. The rate is 10 times more than
the national average for job growth, as a continued decline in
installation costs spurs demand for solar power systems.
Compare those 23,682 new solar jobs
to this claim on the website of the
U.S. House Energy and Commerce Committee
about the Keystone XL tar sands oil pipeline
the U.S. Senate just rejected:
According to the
State Department’s Environmental Impact Statement,
“During construction, proposed Project spending would support
approximately 42,100 jobs (direct, indirect, and induced), and
approximately $2 billion in earnings throughout the United States.”

As that House website laments, it’s been more than six years since
Keystone XL was proposed.
Meanwhile, the solar industry added more than half that many jobs
in a single year, without any need to gouge a leaky hazardous
pipeline through the Ogallala Aquifer and across half the U.S.
Back to the Bloomberg story:
“The solar industry’s job-creating power is clear,”
Andrea Luecke, president of the Washington-based foundation, said in
the statement. “For the fourth year running, solar jobs remain
well-paid and attract highly skilled workers.”The rate of growth is expected to slow in the next 12 months to 15.6
percent as developers scale back on large solar projects, the report
found. Of the 22,240 additional solar jobs predicted, developers are
planning to add 360 workers as the federal government’s investment
tax credit is set to expire in 2016, reducing bank funding
opportunities for new projects.
That decreased projected growth rate of 15.6% would still be
more than 7 times the national average for job growth.
Let’s project that forward, along with the oil and gas jobs
observed growth rates:
| Jobs | Growth Rate | 2012 | 2013 | 2014 | 2015 | 2016 | 2017 | 2018 | 2019 | 2020 |
|---|---|---|---|---|---|---|---|---|---|---|
| Solar Jobs | 15.6% |
119,000 |
142,000 |
164,152 | 189,759 | 219,362 | 253,582 | 293,141 | 338,871 | 391,735 |
| Oil and Gas Extraction production and non-supervisory |
3.95% |
106,400 |
110,600 |
114,965 | 119,503 | 124,221 | 129,124 | 134,221 | 139,519 | |
| Oil and Gas Extraction Total |
7.89% |
197,500 |
213,100 |
229,932 | 248,093 | 267,689 | 288,833 | 311,648 | 336,824 |
At those rates, solar jobs will pass total oil and gas jobs
by 2018, which is about the year
solar energy production will pass oil energy production in the U.S.
Of course, those rates won’t continue exactly like that for that long.
More likely, the fossil fuel bubble will pop by then and oil and gas
jobs will decrease, as
is already happening with coal mining jobs.
Which will make solar deployment and jobs rise even faster.
Back to the Bloomberg story to look even farther ahead:
U.S. solar energy capacity jumped 35 percent in the third quarter
driven by large-scale projects, according to the Solar Energy
Industries Association. A February 2012 U.S. Energy Department study
predicted that employment in the solar industry will reach more than
340,000 by 2030.
So U.S. DoE projects slower solar job growth, but it probably didn’t
project that 20% 2012-2013 solar job increase, either.
Even if DoE is correct, solar jobs still are increasing far faster
than the national average.
Here’s why:
The cost of installed solar equipment has dropped more than 50
percent since the start of 2010, the foundation said. Installers
make an average of $23.63 an hour, according to the survey.“The American solar industry has the potential to be one of
the greatest job creators this country has ever seen,”
SolarCity Corp. (SCTY) Chief Executive Officer Lyndon Rive said in
the statement. The solar installation company has added more than
2,000 jobs since the start of 2013, he said.
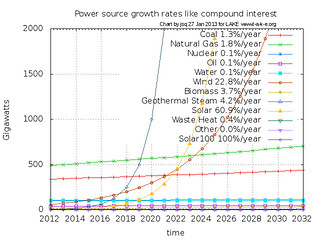
The continuing price drop in solar power equipment costs
is what keeps driving solar deployment and solar employment up.
That’s on house tops and business roofs and solar farms where
people actually want solar power.
Solar power that doesn’t leak or explode,
requires no fuel, and needs no testing or cooling water.
Bringing solar jobs right here where we need them,
and bringing down energy bills.
While fossil fuel deployment requires interstate oil and gas pipelines
on massively environmentally destructive rights of way.
Pipelines that corrode, leak, and explode.
Pipelines to export fossil fuels to foreign markets for profit for
a few industry executives and investors, while running up domestic
prices for those same fuels.
Let the sun rise.
-jsq