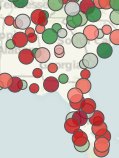
Valdosta #51 of 379!
Closest MSAs as green on
the map are Auburn-Opelika #37,
Atlanta #41, Charleston #11, and
Nashville, TN at #14.
Highest weighted components are for
growth in jobs, wages, and salaries,
so apparently there has been some improvement in those areas.
Here are the rank components from
the PDF report,
plus the corresponding scores from
www.best-cities.org:
| Rank | Job Growth | Wage Growth | Short-Term Job Growth |
High-Tech GDP Growth |
High-Tech GDP LQ |
Number of High-Tech Industries |
|||||
|---|---|---|---|---|---|---|---|---|---|---|---|
| Change | 2012 | 2013 | 2007-12 | 2011-12 | 2006-11 | 2010-11 | 7/2012- 7/2013 | 2007-12 | 2011-12 | 2012 |
with LQ≥1 2012 |
| 50 | 101 | 51 | 128 | 33 | 73 | 133 | 84 | 15 | 4 | 76 | 13 |
| Score | 97.36 | 100.68 | 102.32 | 97.65 | 109.89% | 129.20 | 119.63 | 0.56 | 6.0 | ||
The five job growth components are weighted 1/7th each,
and the four high-tech components are weighted half as much,
1/14th each.
The first four scores appear to be relative to 100 for the entire U.S.
Where exactly
Milliken Institute
got their data is not clear,
especially for
these: Continue reading