According to FERC’s own figures from 2012 and 2016,
my solar projections from 2013 (and former FERC Chair Jon Wellinghoff’s) were pretty good,
and more U.S. electricity will still come from solar power by 2023.
 Since coal and nuclear are already crashing, and natural gas isn’t
increasing even as fast as formerly projected, solar could win even faster.
Since coal and nuclear are already crashing, and natural gas isn’t
increasing even as fast as formerly projected, solar could win even faster.
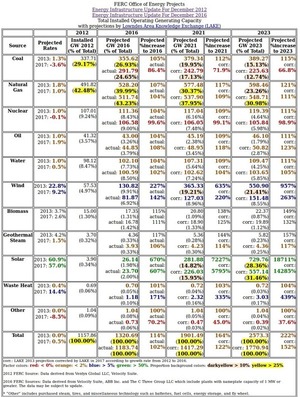
I constructed table below from the 2012 and 2016 summaries of total U.S. electric power generation from all sources, by the Federal Energy Regulatory Commission (FERC).
Look at the 2012 column: only coal and natural gas generated more than 25% of total U.S. electricity.
But in 2016 it’s only natural gas, because coal’s growth rate actually turned negative: utilities are shutting down coal plants, not building them. Back in 2013 I did not predict that to happen so quickly.
Now look at
the growth rates,
 both
my 2013 projections (see also the graph on the right) and my corrected 2017 projections.
Only wind (and waste heat) is higher than 5%, plus solar alone at more than 50%
new installed capacity per year.
According to FERC’s 2016 figures (the “actual:” numbers in the 2016 columns),
my 2013 solar projection was a little high by deployed utility-scale solar power,
but was actually low as a proportion in 2016, because coal and nuclear are already crashing.
Sure, one new nuclear power plant opened in 2016, but more than one closed.
both
my 2013 projections (see also the graph on the right) and my corrected 2017 projections.
Only wind (and waste heat) is higher than 5%, plus solar alone at more than 50%
new installed capacity per year.
According to FERC’s 2016 figures (the “actual:” numbers in the 2016 columns),
my 2013 solar projection was a little high by deployed utility-scale solar power,
but was actually low as a proportion in 2016, because coal and nuclear are already crashing.
Sure, one new nuclear power plant opened in 2016, but more than one closed.
And remember, utility-scale solar power, which is all FERC records in its Energy Infrastructure Updates, isn’t the whole story. FERC recorded 7.748 GW of new solar power in 2016, but SEIA added in rooftop and community solar power for a total of 14.6 GW of new solar power in 2016.
You don’t see rooftop coal, or nuclear, or natural gas. You don’t any of those installed in 9-month or less timeframes, as for solar power: they all require multi-year permitting processes because they’re so environmentally destructive. So it’s very unlikely there are any significant additions to coal, nuclear, or natural gas U.S. energy generation beyond what FERC reported.
Solar power has what we could call the personal computer or mobile phone advantage: anybody can own one. Practically by definition, you’ll never see that advantage for utility-scale power generation.
Looking that the 2021 and 2023 projections in the table, of course they’re naive projections, simply taking the old 2013 rate and the new 2017 corrected rate and projecting them forward. The 2013 rate I made by comparing FERC’s 2012 total figures to previous years. The 2017 rate I made by comparing FERC’s 2016 total figures to its 2012 total figures.
By 2021 coal won’t even account for 25% of U.S. electricity generation, and it didn’t even in FERC’s actual 2016 figures. In 2021 natural gas will account for a higher proportion because of coal’s capitulation, even though it’s actually growing slower than my 2013 projection.
Also in 2021, solar and wind will both be greater than 10% of U.S. generation, although wind will not yet reach that by the corrected projection. Since in 2016 according to SEIA solar actually beat wind for new installed capacity, I wonder if wind is already having trouble competing with solar power.
In 2023, by either my old or new projections, solar power will generate more U.S. electricity than anything else. Wind doesn’t grow nearly as fast by the corrected 2017 factor. Maybe 2016 was a glitch for wind, or maybe there’s something deeper going on.
For how naive these projections are, look at the Total row. U.S. electricty demand is unlikely to increase by 20% by 2021 (only four years from now) and it’s even less likely to increase by 52% by 2023 (only seven years from now). What that actually probably means is that coal and nuclear will crash faster and natural gas will follow them down, leaving solar and wind power as the main sources of U.S. electricity.
 These projections and this table are just to illustrate some basic points.
Other people are doing much more sophisticated projections,
such as
Stanford Professor Mark Z. Jacobson and his research team,
which graphically show fossil fuels and nuclear crashing while solar and wind win.
These projections and this table are just to illustrate some basic points.
Other people are doing much more sophisticated projections,
such as
Stanford Professor Mark Z. Jacobson and his research team,
which graphically show fossil fuels and nuclear crashing while solar and wind win.
Goldman Sachs already called this a year ago, and many other big financial institutions predicted even earlier that solar and wind will win. This economic sea change is driven by solar prices dropping faster than Moore’s Law, which is accelerated by economies of scale as solar deployment increases. Economics are driving politics. Even Georgia in 2015 revised its antique law so third party power-purchase-agreements are now possible, and Georgia has become the fastest-growing U.S. solar market.
LAKE Solar Table 2017
| 2012 | 2016 | 2021 | 2023 | ||||||
|---|---|---|---|---|---|---|---|---|---|
| Power Source | Projected Rates |
Installed GW 2012
(% of Total) |
Projected GW 2016
(% of Total) | Projected %increase to 2016 |
Projected GW 2021
(% of Total) | Projected %increase to 2021 |
Projected GW 2023
(% of Total) | Projected %increase to 2023 | |
| Coal | 2013: 1.3% 2017: -3.6% |
337.71
(29.17%) |
355.62 (26.93%) actual: 291.79 (24.65%) |
105% actual: 86.4% |
379.34 (19.95%) corr.: 242.79 (17.13%) |
112% corr.: 71.9% |
389.27 (15.13%) corr.: 225.63 (12.74%) |
115% corr.: 66.8% | |
| Natural Gas | 2013: 1.8% 2017: 1.0% |
491.82
(42.48%) |
528.20 (39.99%) actual: 511.74 (43.23%) |
107% actual: 104% |
577.48 (30.37%) corr.: 537.90 (37.95%) |
117% corr.: 109% |
598.46 (23.26%) corr.: 548.71 (30.98%) |
121% corr.: 111% | |
| Nuclear | 2013: 1.0% 2017: -0.1% |
107.01
(9.24%) |
111.36 (8.43%) actual: 106.58 (9.00%) |
104% actual: 99.6% |
117.04 (6.16%) corr.: 106.05 (7.48%) |
109% corr.: 99.1% |
119.39 (4.64%) corr.: 105.84 (5.98%) |
111% corr.: 98.9% | |
| Oil | 2013: 1.0% 2017: 1.9% |
41.32
(3.57%) |
43.00 (3.26%) actual: 44.85 (3.79%) |
104% actual: 108% |
45.19 (2.38%) corr.: 48.95 (3.45%) |
109% corr.: 118% |
46.10 (1.79%) corr.: 50.82 (2.87%) |
111% corr.: 123% | |
| Water | 2013: 1.0% 2017: 0.5% |
98.12
(8.47%) |
102.10 (7.73%) actual: 100.59 (8.50%) |
104% actual: 102% |
107.31 (5.64%) corr.: 102.62 (7.24%) |
109% corr.: 104% |
109.47 (4.25%) corr.: 103.65 (5.85%) |
111% corr.: 105% | |
| Wind | 2013: 22.8% 2017: 9.2% |
57.53
(4.97%) |
130.82 (9.91%) actual: 81.87 (6.92%) |
227% actual: 142% |
365.33 (19.21%) corr.: 127.03 (8.96%) |
635% corr.: 220% |
550.90 (21.41%) corr.: 151.48 (8.55%) |
957% corr.: 263% | |
| Biomass | 2013: 3.7% 2017: 2.6% |
15.00
(1.30%) |
17.35 (1.31%) actual: 16.78 (1.42%) |
115% actual: 111% |
20.80 (1.09%) corr.: 18.90 (1.33%) |
138% corr.: 125% |
22.37 (0.87%) corr.: 19.89 (1.12%) |
149% corr.: 132% | |
| Geo- thermal Steam | 2013: 4.2% 2017: 1.5% |
3.70
(0.32%) |
4.36 (0.33%) actual: 3.93 (0.33%) |
117% actual: 106% |
5.36 (0.28%) corr.: 4.23 (0.30%) |
144% corr.: 114% |
5.82 (0.23%) corr.: 4.36 (0.25%) |
157% corr.: 117% | |
| Solar | 2013: 60.9% 2017: 57.0% |
3.90
(0.34%) |
26.14 (1.98%) actual: 23.70 (2.00%) |
670% actual: 607% |
281.88 (14.82%) corr.: 226.03 (15.95%) |
7227% corr.: 5795% |
729.76 (28.36%) corr.: 557.14 (31.46%) |
18711% corr.: 14285% | |
| Waste Heat | 2013: 0.4% 2017: 14.4% |
0.69
(0.06%) |
0.70 (0.05%) actual: 1.18 (0.10%) |
101% actual: 171% |
0.72 (0.04%) corr.: 2.32 (0.16%) |
103% corr.: 335% |
0.72 (0.03%) corr.: 3.03 (0.17%) |
104% corr.: 439% | |
| Other | 2013: 0.0% 2017: -8.5% |
1.04
(0.09%) |
1.04 (0.08%) actual: 0.73 (0.06%) |
100% actual: 70.2% |
1.04 (0.05%) corr.: 0.47 (0.03%) |
100% corr.: 45.0% |
1.04 (0.04%) corr.: 0.39 (0.02%) |
100% corr.: 37.6% | |
| Total | 2013: 0.0% 2017: 0.5% |
1157.86
(100.00%) |
1320.69 (100.00%) actual: 1183.74 (100.00%) |
114% actual: 102% |
1901.49 (100.00%) corr.: 1417.29 (100.00%) |
164% corr.: 122% |
2573.3 (100.00%) corr.: 1770.94 (100.00%) |
222% corr.: 152% | |
|
corr.: LAKE 2013 projection corrected by LAKE in 2017 according to growth rate from 2012 to 2016.
Factor colors: red: < 0%; orange: < 2%; blue: > 5%; green: > 50%. Proportion background colors: darkyellow > 10%; yellow > 25%. 2012 FERC Source: Data derived from Ventyx Global LLC, Velocity Suite. 2016 FERC Sources: Data derived from Velocity Suite, ABB Inc. and The C Three Group LLC which include plants with nameplate capacity of 1 MW or greater. The data may be subject to update. * “Other” includes purchased steam, tires, and miscellaneous technology such as batteries, fuel cells, energy storage, and fly wheel. | |||||||||
Waste Heat
What is the mysterious Waste Heat that FERC does not define in either of the source reports? EPA defines it like this:
Waste heat to power (WHP) is the process of capturing heat discarded by an existing industrial process and using that heat to generate power (see Figure 1). Energy-intensive industrial processes—such as those occurring at refineries, steel mills, glass furnaces, and cement kilns—all release hot exhaust gases and waste streams that can be harnessed with well-established technologies to generate electricity (see Appendix). The recovery of industrial waste heat for power is a largely untapped type of combined heat and power (CHP), which is the use of a single fuel source to generate both thermal energy (heating or cooling) and electricity.
So waste heat is efficiency measures for existing thermal industrial processes. Thus it is unlikely ever to account for a significant proportion of electricty generation.
Putting it another way, waste heat is greenwashing obsolete power generation. Case in point: Status of Waste Heat to Power Projects on Natural Gas Pipelines, November 2009, prepared for Interstate Natural Gas Association of America (INGAA). Sorry, fracked methane purveyors, waste heat won’t save you.
Solar power will soon account for the largest proportion of U.S. electricity generation.
And that’s just the start. We know how to get to 100% sun, wind, and water power for the U.S. by 2050, for everything, including heating, cooling, and transportation. Solar power will win like the Internet did.
 Let the sun rise!
-jsq
Investigative reporting costs money, for open records requests, copying, web hosting, gasoline, and cameras, and with sufficient funds we can pay students to do further research. You can donate to LAKE today!
Short Link:
Pingback: New solar up 95% in 2016, more installed than gas or wind | On the LAKE front
Pingback: How much solar power could Sabal Trail’s $3.2 billion buy? | On the LAKE front